cosinuss° Health Platform
Remote vital signs monitoring using c-med° alpha or cosinuss° Two with the Gateway and the cosinuss° Health Platform.
Important notes to start with monitoring vital signs
- Make sure the Gateway is connected to the internet and a power supply.
- The in-ear sensor, c-med° alpha or cosinuss° Two, should be switched on and inserted inside the ear canal.
- The default measurement setting is to initiate a 3-minute measurement period for an interval of every 15 minutes. The measurement cycle is configurable. Please contact us for custom configuration.
- The battery life in default configuration is approximately 24 hours, with a charging time of approximately 1 hour.
- Once the Gateway is connected to a power outlet, a connection between Gateway and sensor is automatically established, provided that a distance of 10 meters (Bluetooth range) is not exceeded, and the sensor is permanently inside of the ear canal during a measurement (the measured body temperature should exceed 30 °C).
- Sensor size and the fitting of the sensor in the ear is very important for measurement accuracy. Further instructions are provided here.
Requirements for the visualization of vital parameters in the web interface dash
In order to have the vital sign data displayed in the web interface dash, the following prerequisites must be met:
- The receiver registration of the Gateway must be completed and ensure the Gateway is connected with the internet and a power supply.
- The device registration of the c-med° alpha or cosinuss° Two must be completed, and the sensor needs to be turned on and inserted firmly insight of the ear canal.
- A person with a pseudonym has to be created or edited for each test subject. Also, both a sensor and a Gateway have to be assigned with a pseudonym in order to link the generated vital signs data to a subject. In addition, the assignment consisting of a person, a sensor, and a Gateway must be connected to a project.
- After this is done, go to DASH in the menu bar and the vital signs data should be visualized shortly after. However, due to the currently used standard configuration of the cosinuss° Health Platform, it might take a few minutes until values will be visible on the Dash.
If you need additional information or if still no data points are being presented, please take a look here.
Login to the cosinuss° Health Platform
- Cosinuss GmbH creates your account on the cosinuss° Health Platform and sends you your username and password.
- URL to the cosinuss° Health Platform: https://health.cosinuss.com/
WEB INTERFACE TABS
The web interface tabs can be found in the upper menu bar displayed below. These options allow navigation within the system. A detailed explanation of each menu option is provided below.

DASH
The dashboard shows the vital signs card for each patient with an assigned Gateway and sensor. The card contains 4 vital parameters and 2 quality indices, a deviation score, as well as sensor information and time since the data was received. The measured parameters are explained here, the rest of the card is explained in more detail in the subsections below.

| Numeric legend | Displayed information |
|---|---|
| 1 | Patient pseudonym |
| 2 | Serial number of sensor |
| 3 | Battery level |
| 4 | Time of the last measurement |
| 5 | Deviation score |
| 6 | Vital sign parameters |
| 7 | Quality indicators |
The displayed data is calculated as follows:
- HR (Heart rate): Median of the last measurement.
- Temp (Temperature): Median of the last measurement.
- SpO2 (Blood Oxygen Saturation): Maximum of the last measurement.
- RR (Respiration rate): Median of the last measurement.
- Perfusion (Perfusion index): Minimum of the last measurement.
- Quality (Heart Rate quality): Median of the last measurement.
- Battery (Battery Level): Median of the last measurement.
If the default setting is used, then the median of the last measurement would be based on this 3 minute time interval.
- All values of the last measurements are visualized and available through a click on the bold blue person pseudonym, which leads to the daily view.
- The appearance of the values may change depending on the age of the single parameters and the current deviation score. Take a look at our example scenarios.
- Currently, the standard configuration of the cosinuss° Health Platform is to start every 15 minutes a measurement of 3 minutes duration. After the measurement is completed, the respective values are calculated and shown on the Dash. A detailed description of the general data structure and each recorded parameter can be found here.
- For the most accurate data acquisition, ensure that there is as little talking and chewing as possible during the measurements. Also, incorrect placement of the sensor inside the ear canal can lead to inaccurate data.
- Please make sure that a stable connection between the sensor and the Gateway is provided in order to have a continuous data transmission. Additional information on the full usage and functionality of the system is available here.
Patient ID (person pseudonym):
The pseudonym of a person is written in a bold blue abbreviation and is located in the upper-left corner of the diagram. Click on abbreviation to display the vital sign graphs (with all values from the current day 0-24 h). Click through different days for the history. The options of the daily view are described in the corresponding section.
Battery:
The current battery level of the sensor is illustrated here. When the battery level reaches 5 percent, the battery status will be highlighted in orange lettering. Please be aware that battery life in default configuration is approximately 24 hours and the charging time is approximately 1 hour.
Time:
This is the time, which has passed since the last measurement. If the clock is displayed in green, then the sensor is connected to the Gateway and a measurement is in progress.
Possible reasons if the timer raises above 15 min in the Gateway's default configuration may be:
- Sensor is out of Bluetooth range (> 10m) from the Gateway
- The sensor battery is empty
- Temperature < 30 °C (i.e. sensor is not in the ear)
- The Gateway has no stable internet connection
Only when the clock is displayed in green are these correct person-related values. Since the very latest update, information about the sensor is also displayed, even if no connection has yet been established with the Gateway. This includes, battery level, signal strength and temperature values. These are sensor-specific data and do not represent vital signs of an individual.
Deviation Score:
It is displayed in the colored area and based on the four vital parameters (please see the table below):
- The score indicates an overall magnitude of deviation from the normal range per person, in traffic light colors.
- Calculation is similar to the Early Warning Score system: a score is given to each parameter as they are measured, with the magnitude of the score reflecting the deviation from the norm.
| Parameter / Score | 3 | 2 | 1 | 0 | 1 | 2 | 3 |
|---|---|---|---|---|---|---|---|
| SpO2 (%) | ≤ 91 | 92 - 93 | 94 | ≥ 95 | |||
| Respiratory rate (1/min) | ≤ 8 | 9 - 11 | 12 - 20 | 21 - 24 | ≥ 25 | ||
| Heart rate (1/min) | ≤ 40 | 41 - 50 | 51 - 90 | 91 – 110 | 111 - 130 | ≥ 131 | |
| Temperature (°C) | ≤ 35.0 | 35.1 – 36.0 | 36.1 – 37.9 | 38.0 - 39.0 | ≥ 39.1 | ||
Then the four individual scores are summed up to generate the overall deviation score:
| Deviation Score | Magnitude |
|---|---|
| 0-3 | Low |
| 4-5 | Intermediate |
| ≥ 6 | High |
- Parameter score “0” indicates the normal range.
- Parameters in the vital card change their color according to their current individual score.
- If one single parameter has a score of 3 (very poor outlier parameter) then the overall score will turn to 6.
- The overall score is only displayed if all 4 vital parameters were calculated in the last measurement, otherwise it is '- -'.
- Warning: For the SpO2 (Blood Oxygen Saturation) and respiratory rate parameters, measurements are strongly influenced by moving, speaking, or chewing. In this case, it may happen that less correct no SpO2 or respiratory rate values are calculated by the algorithm.
—-
Quality value:
Q is an indicator only for the Heart Rate data quality.
| Quality value | Grading |
|---|---|
| < 30 | Poor measurement quality |
| 30 - 45 | Alright |
| 45 - 60 | Good values |
| > 60 | Excellent values |
- Based on the previous quality values Q, consider whether the displayed heart rate values can be correct and whether the current Q value will not change again soon. For example, if Q was previously in a good range and has currently dropped, it may be that the next measurement is OK (if not, you should contact the person and readjust the sensor in the ear). Please take appropriate measures here.
- Wait and see if the quality value catches on.
- Include temperature in the quality assessment. If it is too low, the sensor is not properly seated in the ear.
Perfusion Index:
The Perfusion Index is a quality indicator for SpO2 measurement. It is influenced by different factors: blood circulation, ambient temperature, body position (sitting/lying), skin color, etc.
| Perfusion Index | Grading |
|---|---|
| < 0,1 | Poor / Unreliable |
| ≥ 0,1 | Good |
| 0,2 - 2 | Very good |
| > 2 | Poor / Unreliable |
Further information about whether the received data has been affected by distortion and which data set characteristics indicate an adequate data validity and accuracy is available here.
Temperature (T):
Displays the current body temperature of the user (provided the sensor is well-positioned in the ear). Temperature indication is also an indication of a possible poor fit of the sensor:
- Continuous drop in temperature = sensor slips out of the ear.
- Sudden drop = sensor has slipped out of the ear or has been deliberately removed from the ear.
- If the temperature suddenly drops below 30 °C and consequently the measurement no longer continues, the displayed time may be > 15 min.
In these cases, the other values must be questioned!
Other values:
Heart rate is very stable and accurate. Fluctuations in the values are possible and normal. Possible causes for fluctuations can be moving, speaking, or chewing.
SIDEBAR
You can access the sidebar of a person by clicking on its corresponding tile in the DASH view. In the sidebar it is possible to observe live data and the historical development of vital parameters. The selected user's tile will be grayed out as shown in the following illustration. Via the PERSONS and DEVICES tabs within the sidebar, settings of the devices and user data can be logged.
By clicking on a persons' pseudonym, you will not arrive at the Daily View anymore. Instead, click on the chart inside the sidebar to arrive at the new combined view, the Data View.
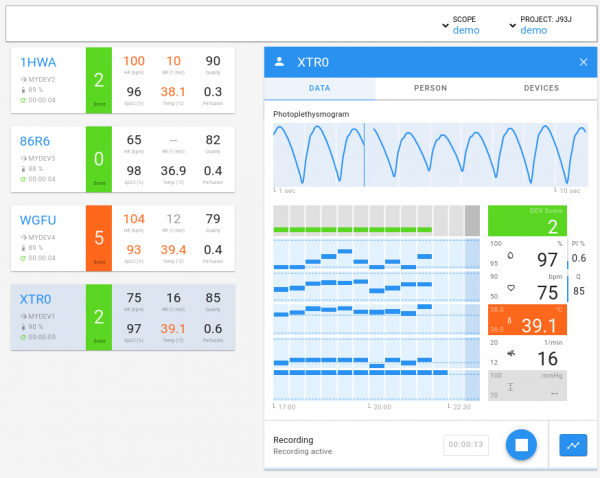
Display of data in the sidebar
In the sidebar you will see the recorded data of the last six hours as bar diagrams of:
- Deviation Score
- Blood oxygen saturation
- Heart Rate
- Core Temperature
- Respiration Rate
The time intervals of the diagrams are divided into 30 minutes slots.
The quality indicator bars (Perfusion Index and Quality) fill up to show how reliable the corresponding measurements are. A low quality indicator is also indicated by the background color of the vital signs bar diagram. It can occur that the vital value is displayed with orange background due to low quality indicator, although the plotted value is in the optimal range. In this case, the value has to be nonetheless questioned. Values with a low quality indicator will be shown in lighter gray in the bar diagram itself.
If the upper and lower limits of the vital parameters are exceeded, a change in the deviation score will be the result.
At the bottom of the sidebar, there is the possibility to start a live measurement of that person by clicking on the play button. Please note that the initialization of the measurement may start a few seconds. The live measurement will run as long as you click on the stop button. During the live measurements vital parameter values are renewed every 10 seconds and you will also see an animated PPG (infrared) signal of the selected person.
Clicking on the time diagrams or on the data icon in the lower right corner of the sidebar, you will arrive at the Data View.
DATA VIEW
The new Data View of the cosinuss° Health platform enables an even more comprehensive and compact display of the measured data. The functionality, which was originally split into two different views, the Day View and the Detailed View, has now been combined into one single Data View.
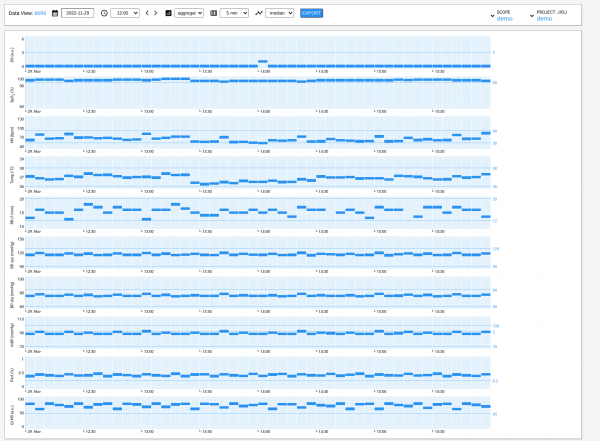
Operation of the Data View
By clicking on a section of the measured data, the temporal axis can be enlarged. By clicking again on a subset of the data, you get the data displayed as a graph.
Menu bar options
The calendar in the Data View bar can be used to select a specific day for which the data is to be displayed. The adjustable time indicates the start time from which the data for the day will be displayed. By using the arrows next to the time setting, you can jump to the previous or next day.
Display options The data format can be selected as well. You can choose between raw data and aggregated data. With aggregated data, you can select either to have the median or a Boxplot of all measured values displayed.
The export button allows you to download the vital data. You can use the settings just explained to adapt the data set to your needs.
DATA
Hover the mouse over Data in the menu bar to get the options Data CSV Download and Data Calendar displayed.

DATA CSV DOWNLOAD
Here you can find an overview of all requested ZIP files that can be downloaded at the moment. The generated ZIP files get all encrypted and the related passwords for the decryption process are listed in the table. It is recommended to use 7-Zip to unzip the files, as this tool performs the decryption of the files properly.
# 7-Zip is free software with open source. The most of the code is under the GNU LGPL license. Some parts of the code are under the BSD 3-clause License.
# Also there is unRAR license restriction for some parts of the code. Read 7-Zip License information.

# installing 7-Zip

# MS Windows
download: https://www.7-zip.org/
# Apple macOS
download: https://www.7-zip.org/download.html

# macOS MacPorts
sudo port install 7zip
# macOS brew
brew install p7zip

# Debian / Ubuntu
sudo apt install p7zip-full p7zip-rar
# Fedora or CentOS / RHEL
sudo yum install p7zip p7zip-plugins
# Arch
sudo pacman -S p7zip
Before you can download the CSV data, you need to request the according data file.
QUERY DATA
After clicking CSV Download, select QUERY DATA. Here you can consecutively select projects, persons, data types that you want to download as compressed CSV data. Once your query is specified enough, click on the “download csv” button.
In the next view, provide a description for your zip file. You may also choose if you want the time values of each data point relative to the start of the data file (in the CSV file: date_time_start) or as unix timestamps. When you are done, click “Confirm” and wait until the zip file is prepared for download.
After the data request, the zip files will stay there for 14 days. If you see no zip files or if you want to download expired data again, you can go to “query for data”.
You can also start a data request in this view. For this, click on Query for data. Again, you can pre-filter the file and add a description.
DATA CALENDAR
Calendar view of all data for a selected project (a project list drop-down menu on the top right is available once you have more than one project).
When you click on a day, you will get a list of all persons with measurements on that selected day. Here you can click “DATA” to jump to the day view. To download the data for the selected day, select the DATA CSV Download menu item.
You can also click on the name of the month to see which person was recorded on which day. From here you can jump directly to the day view of the selected person
PEOPLE
Select PEOPLE in the menu bar to see a list of all person IDs (pseudonyms) and the assignment to the sensors and Gateways. A list of the possible actions is provided below:
Create a person:
A subject needs to be assigned to a Gateway and a sensor. Also, a project needs to be connected with a subject. Therefore, please follow the instructions below:

- Select PEOPLE in the menu bar.
- Choose the correct project with SWITCH PROJECT and then Click on CREATE NEW to create a new person.
- After this, an automatically generated pseudonym has been created and assigned to the person.
- An input field will then open, and person settings can now be entered. These setting options are explained in detail in the following section.
For more information about the CSV data download, click here. However, it is not a prerequisite for creating a person. User data can be downloaded subsequently.
Edit a person:
In some cases, it might be necessary to reallocate sensors and Gateways or change subject information retrospectively. For example, if a different sensor size is needed or a subject is no longer part of a study. For this, select PEOPLE in the menu bar and click on the pseudonym, which is displayed in blue font and also known as the hash ID of the person. Then you enter the person detailed view. Here, more details about one person are listed, and subsequent adjustments can be made. This is the same dialog box that opens automatically after a new person is created, so all the settings described above can also be edited retrospectively. Possible actions are as follows:
- Label: This optional labeling feature can be used to add further descriptions to the pseudonym in order to help to distinguish persons from each other, as subjects are only displayed with their newly created pseudonym. This option is disabled by default and would be displayed in this menu when activated. Then you can change the label of pseudonym here, if this feature is enabled for your project. The user label is displayed in the 3rd column after selecting PEOPLE in the menu bar and can be seen in the dash overview when hovering over the pseudonym. Otherwise, only the pseudonym is displayed
- Active: Activate or deactivate whether data can be recorded for a user. By default, the newly created person is set in the active setting, ready to start measurements at any time. This can be changed at any moment. This can be changed at any moment.
- Status: Project-specific events are documented here, e.g., a test measurement was carried out in the example shown here. More feature are expected in the future, so stay tuned.
- Continuous Recording: Set, a check mark to perform continuous measurements.
- Add Devices/Receivers: New sensors and Gateways can be added to a pseudonym. Please ensure that prior assignments have been removed. Additional information about where to find the UDI or the serial number is provided here.

- Release: To delete the Gateway or sensor assignment of a pseudonym, select 'RELEASE' in the sensor or Gateway info, which becomes visible when you scroll further down in the person detailed view. Make sure to release a sensor or the Gateway before pairing it with a new user.
- Data Chunk: This feature is also available in the sensor info and allows for a compressive data overview of the just collected data.

- Observations and person events: The monitored observations and events are displayed here.

The available and displayed setting options depend on what user rights have been assigned and what settings have been set. The data that may be entered can be adjusted in the project settings. You can find an overview of the different user rights here and how to set up a project here.
- Submit Observation Events: Submit details of measured values from a device like Finger clip, thermometer or Blood pressure monitor. Please note that devices can be added for this feature, in the edit project. An instruction to download the submitted observations can be found her under API.
Further setting and display options:
After selecting PEOPLE in the menu bar, the following options appear when you hover over the row of one particular user.

- RELEASE ALL: Release all sensors and Gateways assigned to a pseudonym.
- PDF: Generate a summarizing PDF label for the selected person.
- DATA: View the data calendar view for the selected person.
- TRIGGER MEASUREMENT: Trigger a measurement for this person with a specific duration.
GATEWAYS
Select Receiver in the menu bar to receive a list of all Gateways with their serial numbers, release id, and assigned persons. Click on the serial number to obtain additional information about one particular Gateway.
Gateway detailed overview
The detailed overview of one particular Gateway includes further details like time since the last synchronization with the server, network status, and much more additional information.
It is also possible to enable Wi-Fi for this Gateway (release ID > 29).
DEVICES
Select Devices in the menu bar to receive a list of all sensors with their serial, release id, and assigned persons. Click on the serial number to obtain additional information about one particular device.
Device detailed view
A Gateway which is assigned and in close proximity to the sensor will periodically send information about the sensor's last found advertising status, which can be seen here. This can be useful to receive feedback about, when the sensor was last seen and what battery level was reported at this point in time.
ADMIN
You will be provided with an admin account for your domain. With this account, it is possible to create new users with different roles and rights. Moreover, different projects within your domain can be created. If you are logged in with an admin account, you will see the ADMIN tab in the menu bar, as shown in the following image.

User
In the user overview, you can see a list of all users, create a new one, edit them or change their password. When clicking on the username, you can see more details of this user.
The following user roles can be assigned to a user upon creation or by editing:
- admin: Can do all the things described in this admin section.
- operator: Can create new person pseudonyms and change the assignment of sensors and Gateways.
- viewer: Can only view the data, people, Gateways and sensors but cannot edit anything.
- api: Can use the API for his assigned projects.
When creating a new user or by editing existing users, users can be assigned to projects within the domain and can be disabled or activated.
- You may assign multiple roles or projects to a user. To do this, hold down the “ctrl” key while selecting roles and projects.
- All users may only see/download the data of a project that they are assigned to.
- Don't forget to assign newly created projects to the existing users if they shall work on this project.
Projects

In the user overview, you can see a list of all projects, create a new one, edit them or see all the data recorded in this project. When clicking on the project's hash ID, you can see more details of this project.
In the project's detailed view, you have some details listed, and you can add new event labels.
Event labels for Person Events can be created for each project. They may be used for a study setting when a person will do different actions (e.g. “Sleeping”, “Sitting”, “Experiment - Step 1”, …) to store the time when this event happened. You have to predefine these labels by editing the project. After adding the labels to the project, go to the detailed view of a (person), where you can select and confirm an event once it is happening. You may download them later using the API.
- When creating a new project, you have to assign this project to all existing users, who shall use this new project.
Help
This link leads to the cosinuss public WIKI start page.
EventLogs
All Events (users/persons/projects/observations created or changed etc.) can be found under this section.
Data presentation in the web interface dash
In the web interface dash, the measured vital sign data gets displayed. The different settings and graphic options are described below. The default recording setting is a 3-minute measuring duration in which data points are acquired for a 3-minute time window. Hereafter, the average of the measured data will be presented in the dash data view. The data gets updated in a 15-minute interval. For Example, the default measuring interval can be broken down as follows: One measuring interval is 15 minutes long and consists of a 3-minute default measuring duration and a 12-minute period in which no new data is being measured or updated. Independently of this, a subdivision takes place into 15-minutes chunk intervals, which are used as the basis for the coloring highlighting scheme down below.
- Scenario 1: No measuring data is available yet. The devices have been previously registered, and a user has been assigned. A pseudonym has been created, which is presented in the upper left part of the screen. However, the data measurement interval is still ongoing and reliable median data cannot be delivered yet. In this case, no value of the individual parameters has been presented, as seen in the diagram below. Please note, it can take up to 15 minutes for the first data measurements to arrive.
![]()
- Scenario 2: The diagram below illustrates the scenario when newly updated data is being integrated into the web interface. In this case, all vital parameters were measured and the system as a whole works correctly.
- The actuality of the measurements is illustrated through data values, which are written in a dark black tone. And the overall design incorporates an intense saturation of colors.

- Scenario 3: The plausibility of the data measurements and the deviation of the respective normal value range gets assessed through a color highlighting scheme.
- The (deviation) score, which is located in the big colorful tile next to the vital parameters, indicates an overall magnitude of deviation from the normal range per person, in traffic light colors. A scale from 0 to 6 is used for this purpose, with the parameter score “0” indicating the normal value range without any deviations. The color division is used to classify the magnitude of the deviation into three different categories ranging from a low (0-3), intermediate (4-5) to a high (6) magnitude of deviation.
- Parameter values displayed in gray appear, when there is no current data available for a period of at least 30 min. This time interval is the default setting, which is not changed if not specially requested. The absence of measured values also leads to a difference in color intensity of the deviation score, as seen in the scenario above and below a difference in the green tones can be observed due to the gray-colored RR parameter.
- Both quality and perfusion are quality indices and assess the data plausibility and validity based on the occurrence of disturbances. Whereas quality is assigned to assess the interference-free and plausible accuracy of the heart rate, perfusion is used analogously to determine the plausibility and the accuracy of the SPO2 measurements.
- Also, the battery status will be highlighted in orange lettering when the battery level reaches 5 percent.

- Scenario 4: After two hours of no new data measurements, the previously displayed value of a parameter disappears.
- The two-hour period is the default setting, which is not changed if not specially requested and is valid for all parameters.
- The deviation score disappears, when at least one of the vital signs is missing.
- There may be differences in when a parameter disappears, as parameters are prone to measurements errors in different ways. As a result, data availability could be more limited for certain parameters. For example, the SPO2 measurement is heavily influenced by movement, resulting in fewer data points and possible earlier disappearance of this parameter in the web interface.

- Scenario 5: In the case of a malfunctioning sensor, the assigned device will be displayed in red lettering. In the example portrayed down below, the photodiode responsible for the SPO2 measurement is unable to detect vital sign data. Therefore, also the associated quality index is indeterminable, and no values are provided for either parameter.

New updates
- An overview of the latest server updates can be found here.
- As soon as a new update is available, a message with New Release will be displayed under the menu options DEVICES or RECEIVERS in the respective row. In addition, you will be informed about a new update when you log onto the cosinuss° Health Platform.
- In case of a non-standard update, which will be specific for your use case, the New Release button appears in orange. In this case, you will be additionally contacted by us directly. For the installation, you can proceed as usual. This type of update should be installed immediately.

Manually update the devices
- To install an update, select RECEIVER in the menu and then click New Release in the respective column of the Gateway. Then you will be presented with information about the latest update and by clicking Update the download will start.
- Alternatively, you can also update all devices at the same time. Simply click on DEVICES in the menu bar and then click on UPDATE ALL.
- After starting the update, you have two hours to turn on the Gateway and connect it to the Internet so that the Gateway can download and install the new updates. If this has not occurred within the time, the New Release button will be displayed again in the row of the Gateway.
Automatically update the devices
- If you want the updates to be performed automatically, you can also configure this.
- For this, you must first have the admin rights. If you are logged in as admin, ADMIN also appears in the menu bar.
- Click on ADMIN in the menu bar and select SETTINGS. Now click on EDIT SETTINGS and after that, you can activate the receiver auto updates.
- Please update your device regularly.
- When our devices are shipped, they will already be updated to the latest version.
Troubleshooting
FAQs → See cosinuss° website / support https://support.cosinuss.com